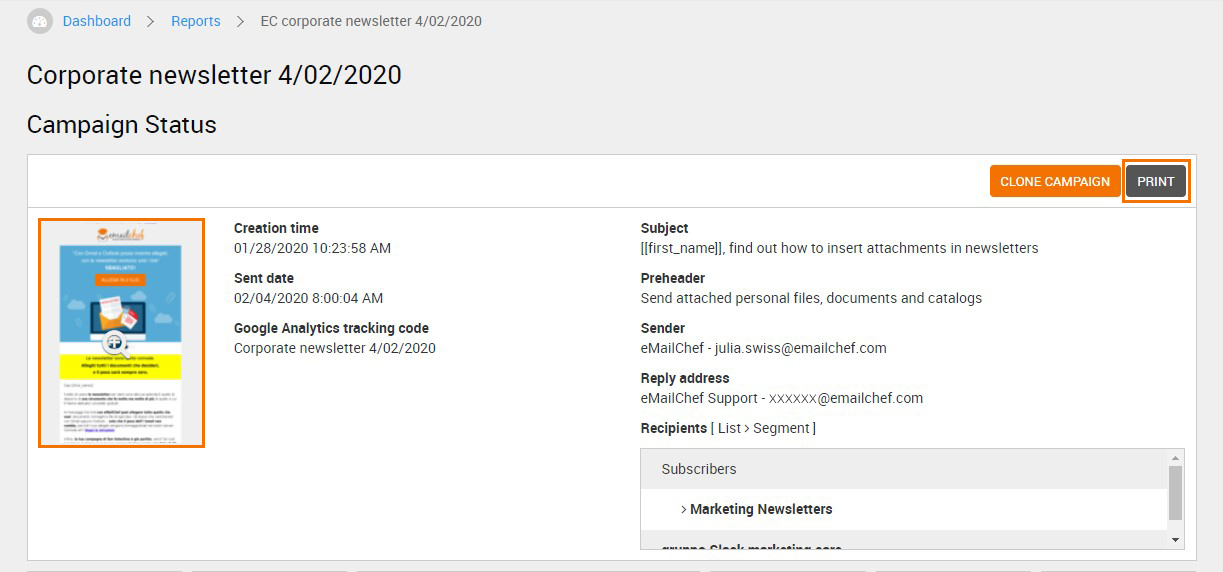
Campaign overview
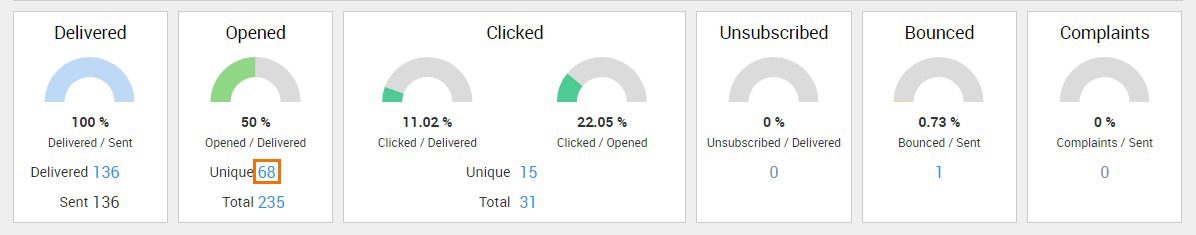
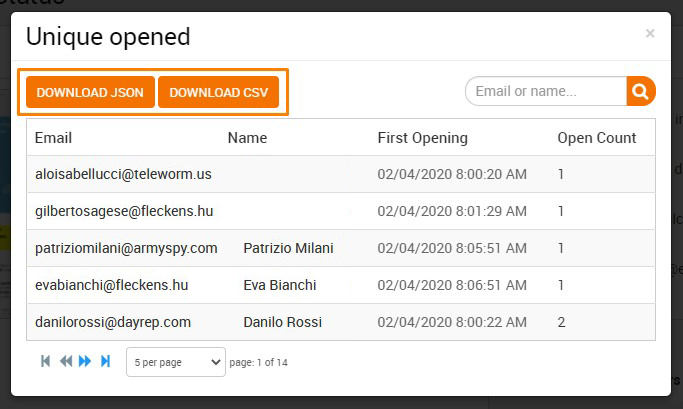
Clicking one of the numerical values displays the data in detail. For example, if you click the numerical value corresponding to unique openings, you’ll be able to see the list of contacts who have opened your email at least once. All lists corresponding to the metrics can be downloaded as a CSV or JSON file by clicking the buttons that appear in the window.
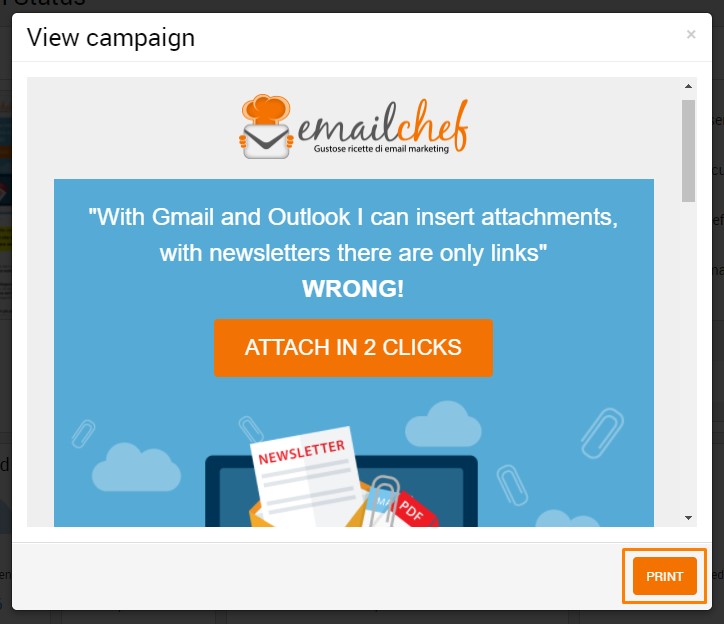
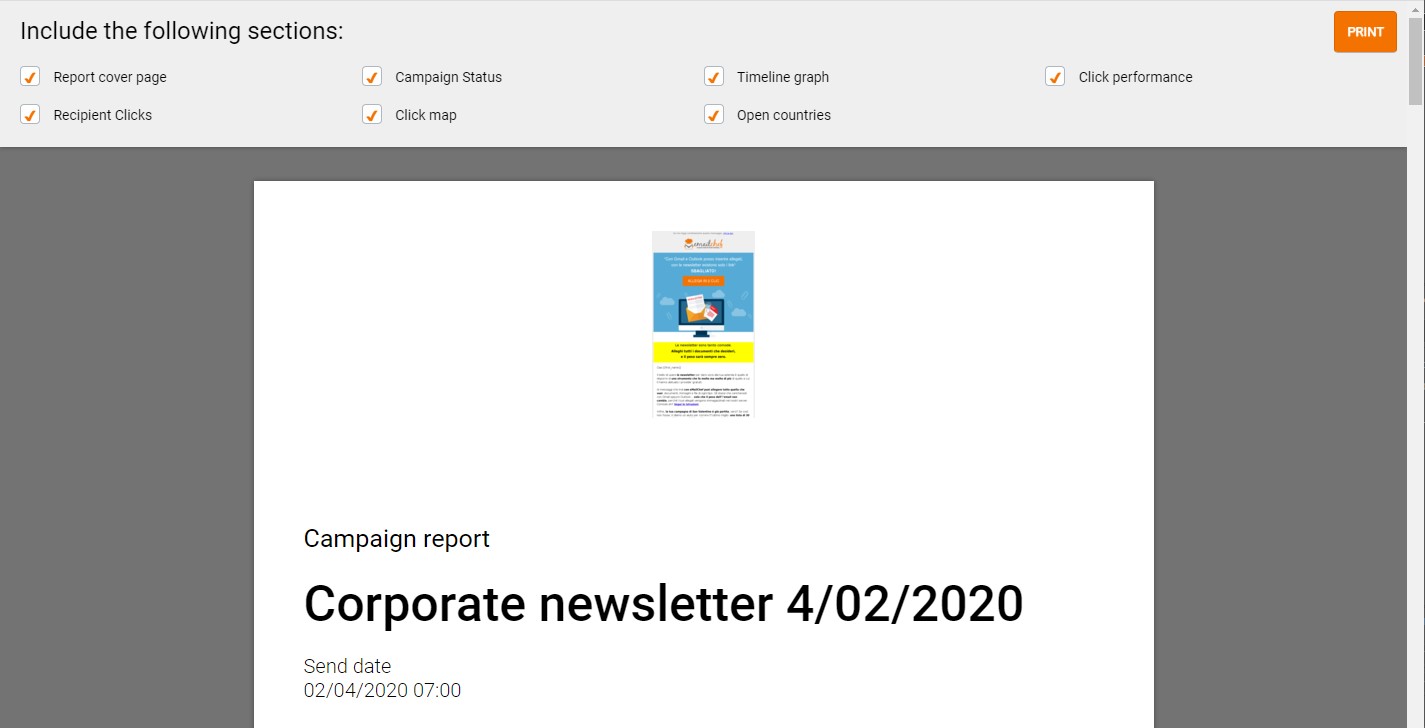
In the campaign overview, you can also save the newsletter as a PDF, print it by clicking the thumbnail, and print the entire report by clicking “PRINT”.
Chronological chart
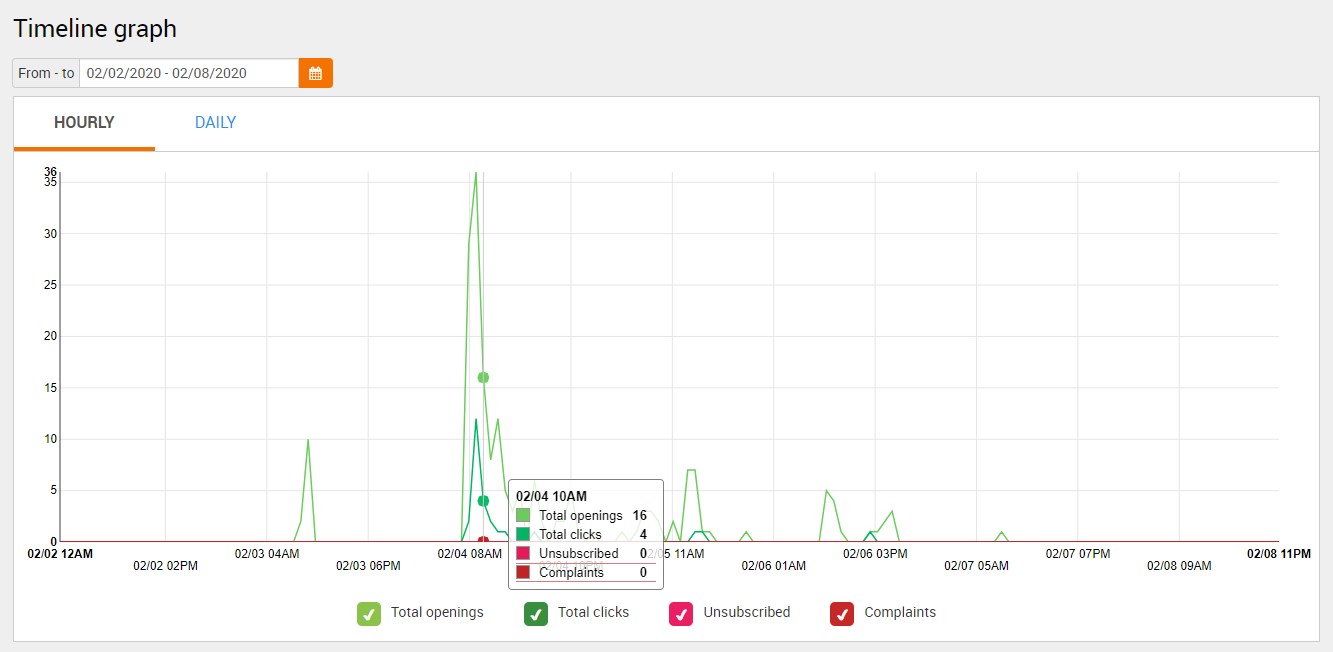
The chronological chart lets you display a single line or several lines of the chart at the same time.
You can also view the course of the campaign across a timeframe. Click the calendar icon, indicate the time period across which you want to view the graph by selecting the start day and the end dates, then click “APPLY”.
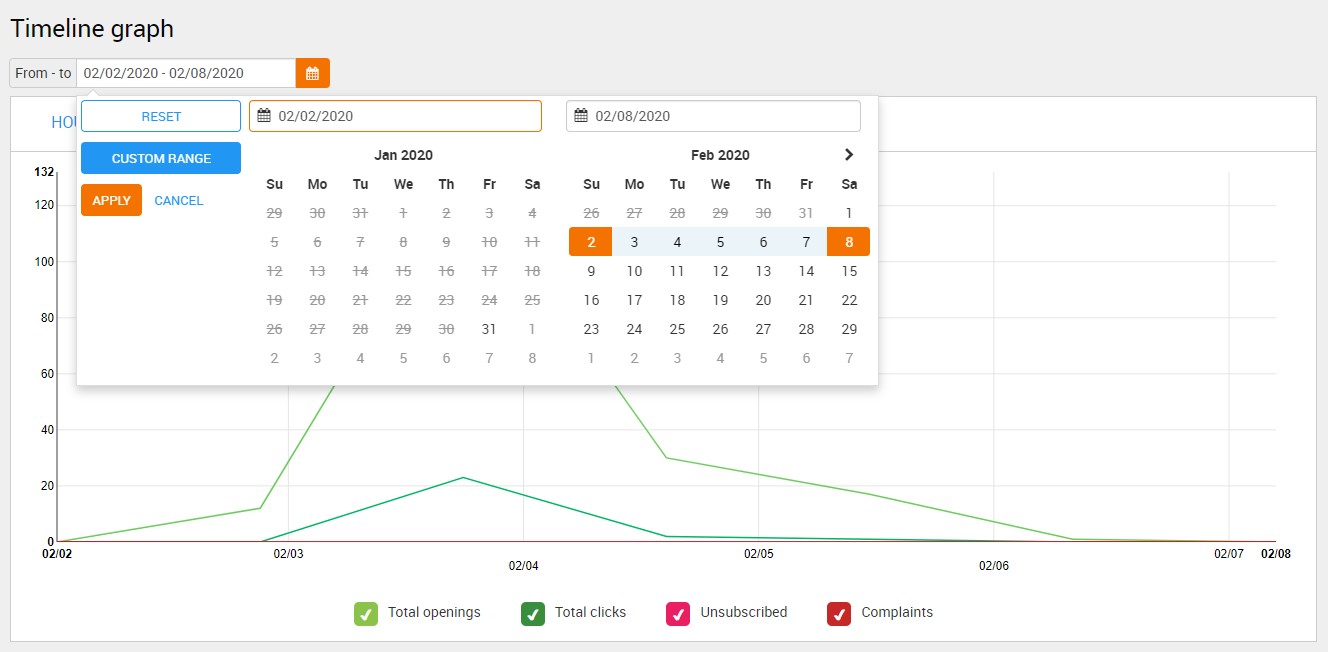
By clicking the “HOURLY” tab, you can see the hourly trend across the chosen timeframe.
To learn more about viewing and tracking your stats, watch this video tutorial:
![[EN] Introducing Campaign Reports](https://emailchef.com/wp-content/plugins/wp-youtube-lyte/lyteCache.php?origThumbUrl=https%3A%2F%2Fi.ytimg.com%2Fvi%2FtAjvX0w0TGU%2F0.jpg)