The sign-up form is a basic element that allows you to collect subscribers to a mailing list. If the form is not appealing, functioning, or well positioned, users will struggle to leave you their data. The more they struggle to supply their email addresses, the harder it will be for you to start a successful email marketing campaign.
It is essential to track the performance of your sign-up forms. You have to perform as many tests as possible, changing the position of the form on the page, trying new CTAs, adjusting the copy, and much more. If you’re looking for some ideas to improve your form and win more subscribers to your newsletter, see our dedicated page.
In the Emailchef section dedicated to the metrics of your form, you can find various stats, such as the number of leads, the number of visits, and the conversion rate. You can also analyze the data relating to a certain period of time by selecting specific dates. The email addresses that the form has collected are displayed under the performance timeline graph, complete with further subscriber data, such as the registration date, location, and the referral pages from which the user reached your form.
To access the data of your form, click “Lists,” then select the name of a list. Finally, from the top bar, click “Sign up forms“.
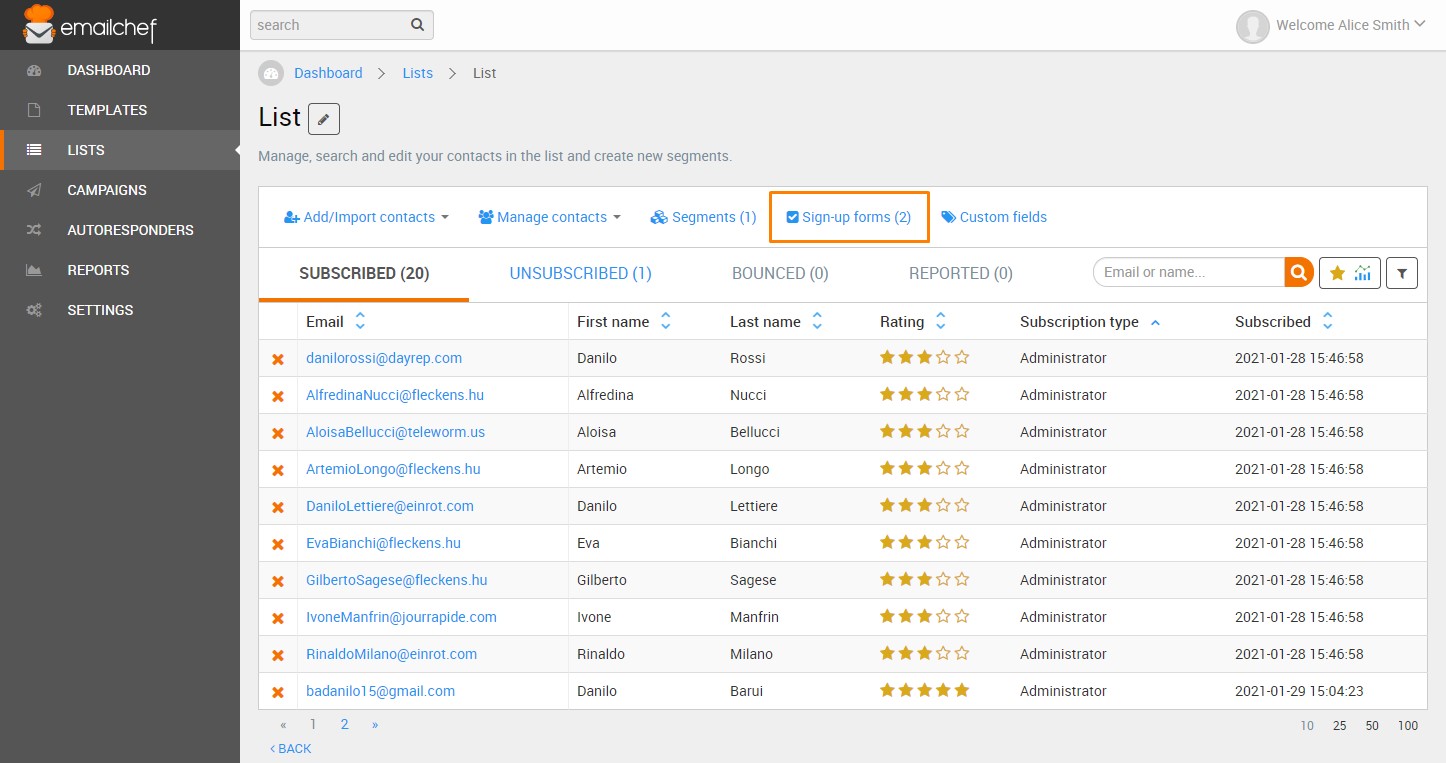
The “Sign up Forms” section displays a list of your forms. Click the module you want to assess.

The page for monitoring form performance contains a number of divisions.
The left side of the box at the top of the page displays a preview of the form. The center of the box shows basic information such as the status of the form and the date of the last modification. On your right, from top to bottom, you can see the number of leads (the number of subscribers obtained), the number of total visits, and the conversion rate (leads/visits).

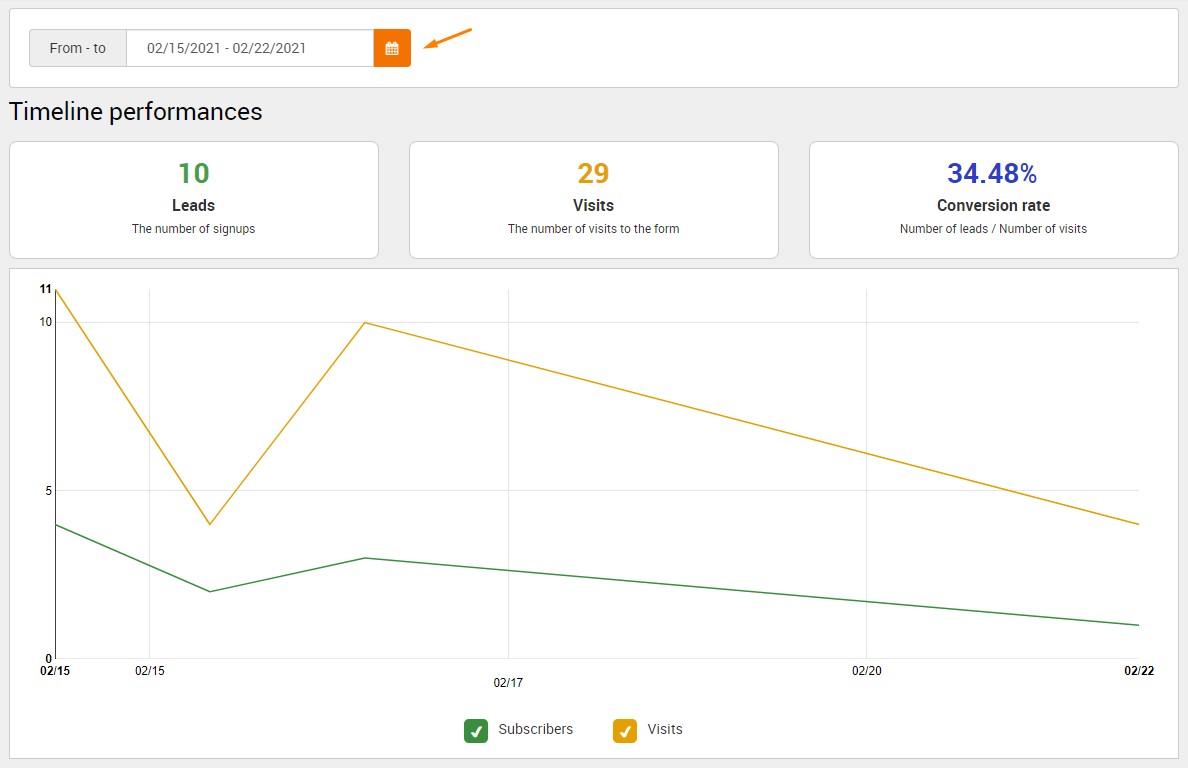
Beneath this box is a section dedicated to “Timeline performances“.
Click the calendar and select a time period. The number of leads collected during that period is displayed on the left. Visits are in the center, the conversion rate is on the right, and a dedicated graph is at the bottom.
Scrolling down, you can see a section dedicated to collected contacts. Here, you can find subscribers’ email addresses, together with additional information on their subscription, such as their location, the type of form they used to subscribe and the referring page, the page from which the user reached the registration form.

We recommend you not to underestimate the value of the data related to the “form type” of the section above. Thanks to that data, you will be able to find out which of the three types of sign-up forms that you can create with Emailchef (embedded, custom and hosted) has performed better.
The three terms EMBEDDED, CUSTOM and HOSTED refer to:
- EMBEDDED: Emailchef forms you have inserted into your website via snippet Javascript
- CUSTOM: Emailchef forms that can be edited via HTML code
- HOSTED: Emailchef forms hosted by our servers, accessible via links
The next section shows “Performance by device“. This data helps you understand which device your subscribers used to fill out the registration form (mobile, desktop or tablet.) You can also see which browser and operating system they use.
If you see that your form is viewed mainly on mobile devices, for example, you might adjust the design to make the registration process easier on smartphones. If you see that many users complete the form on Apple devices, you might run some tests to make sure there are no display problems on Safari.

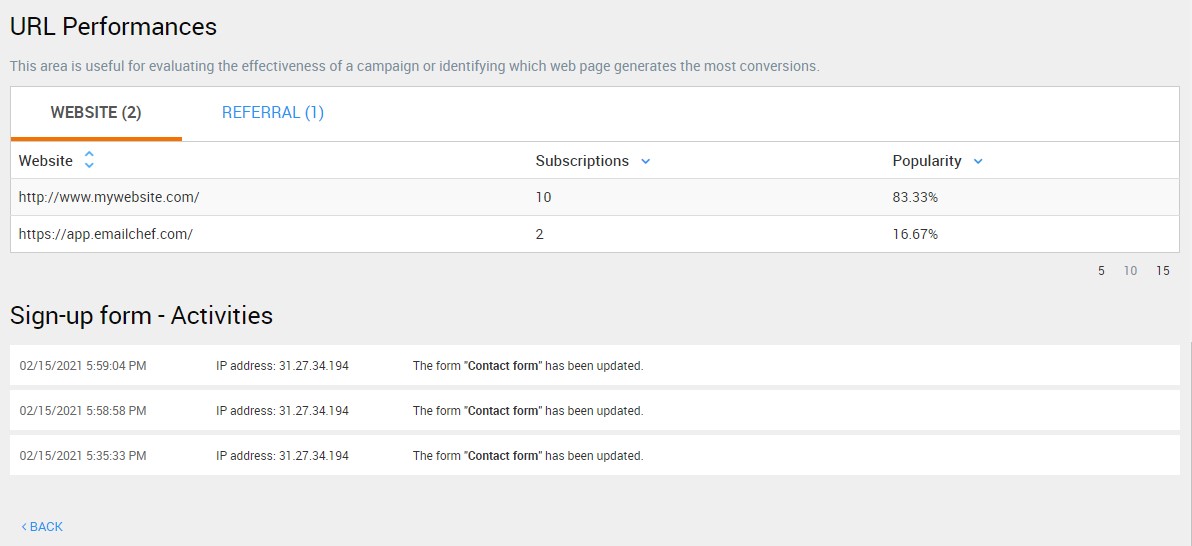
Finally, two sections are dedicated to “URL Performances” (useful for evaluating the effectiveness of a campaign or identifying which web page generates the most conversions), and to “Signup Form Activities” which contains a summary of the activities on the form.
![[EN] Monitor the performance of your registration forms](https://emailchef.com/wp-content/plugins/wp-youtube-lyte/lyteCache.php?origThumbUrl=https%3A%2F%2Fi.ytimg.com%2Fvi%2Fh0brm94Xfb0%2F0.jpg)