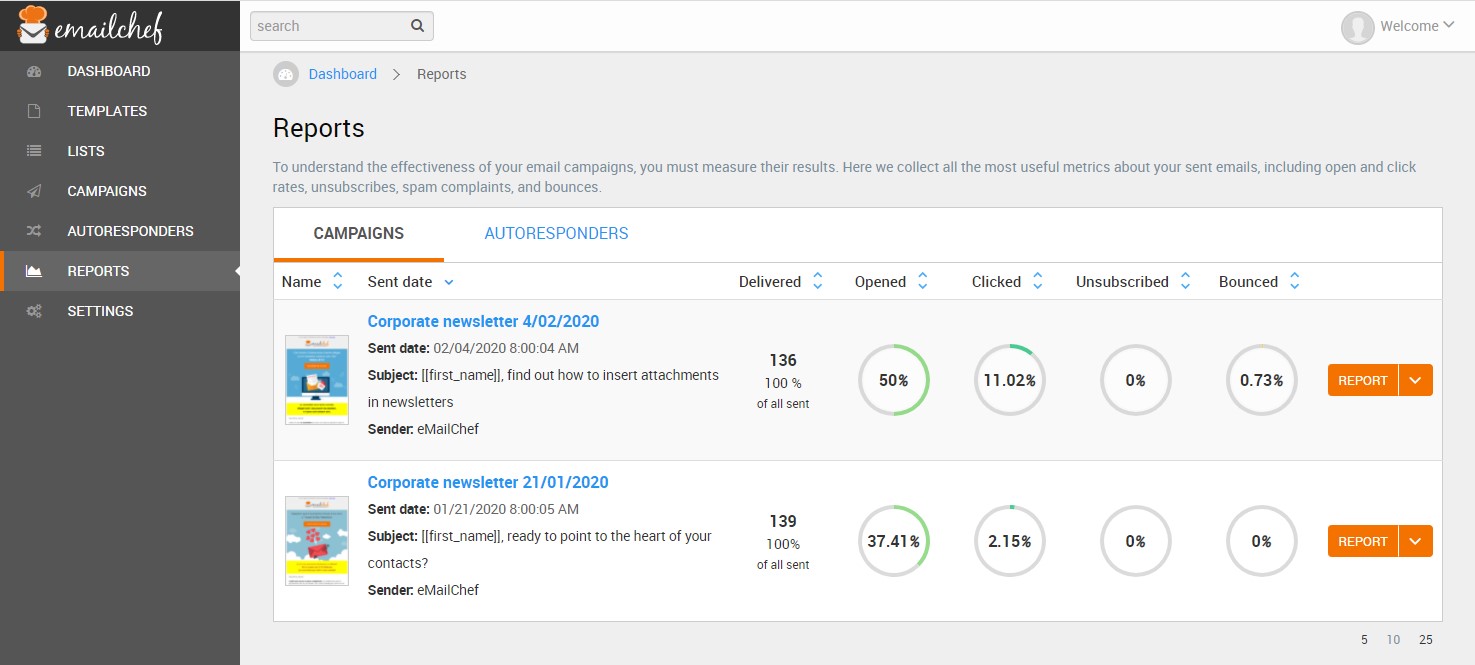
Emailchef lets you monitor your email marketing campaigns with advanced statistics tools and real-time reports. The “REPORTS” section contains a list of all the campaigns sent and shows the most important metrics expressed as a percentage: emails delivered; emails opened; emails clicked; unsubscribes; and bounces. You can also see a list of your autoresponders and view their statistics by clicking the “AUTORESPONDERS” tab.
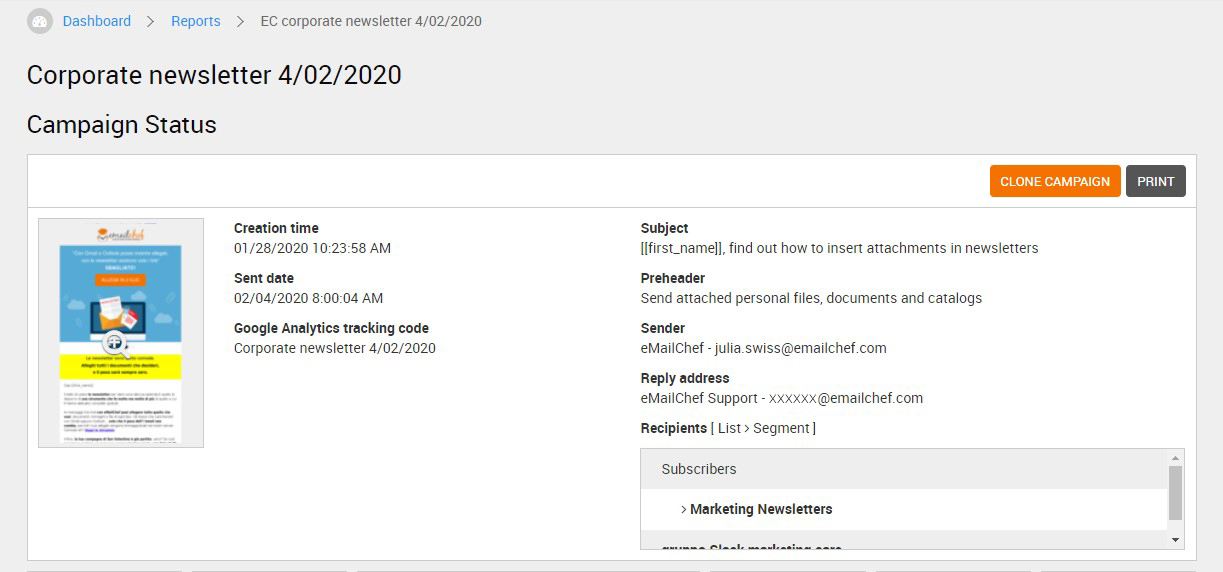
Click the name of a campaign or the “REPORT” button to see the statistics in detail.
The first part is a summary of the campaign sending data: name; subject; preheader; sender; recipients; sending date, etc.
The graphs below show in real time how many emails users have received, how many were opened, and how many were clicked. You can also see the number of unsubscribes, bounces, and spam complaints.
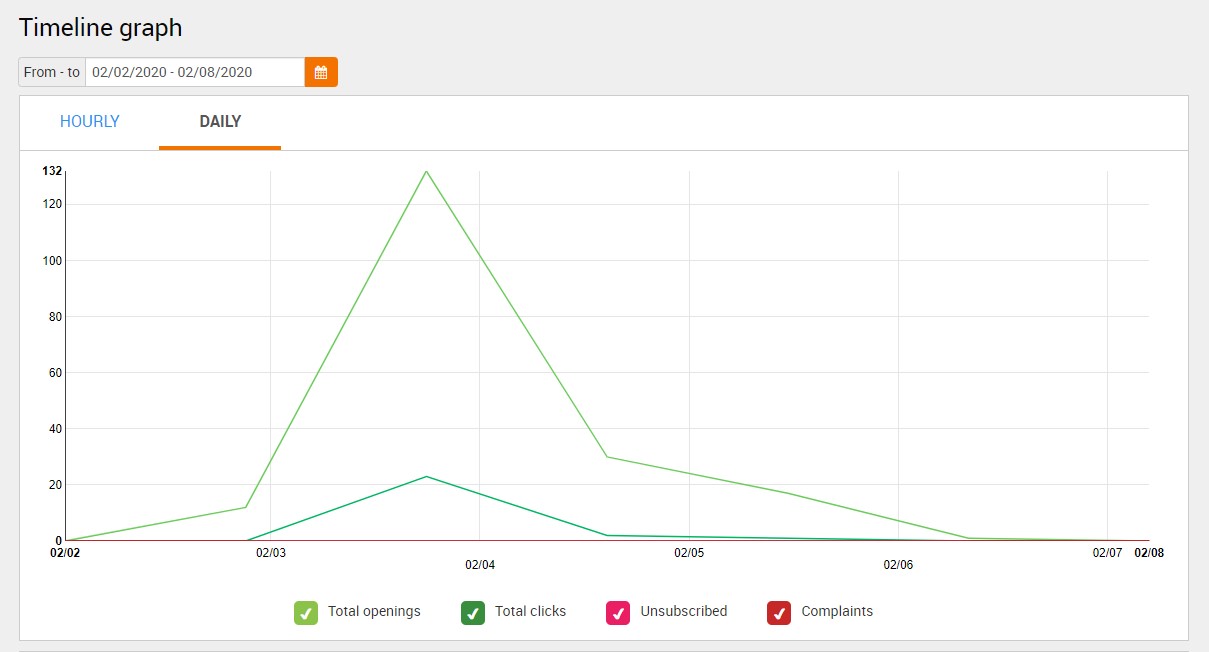
The next graph shows the progress of the campaign over time. The lines of the graph are each marked with a different color (see legend below), and represent total openings, total clicks, unsubscribes, and spam complaints.
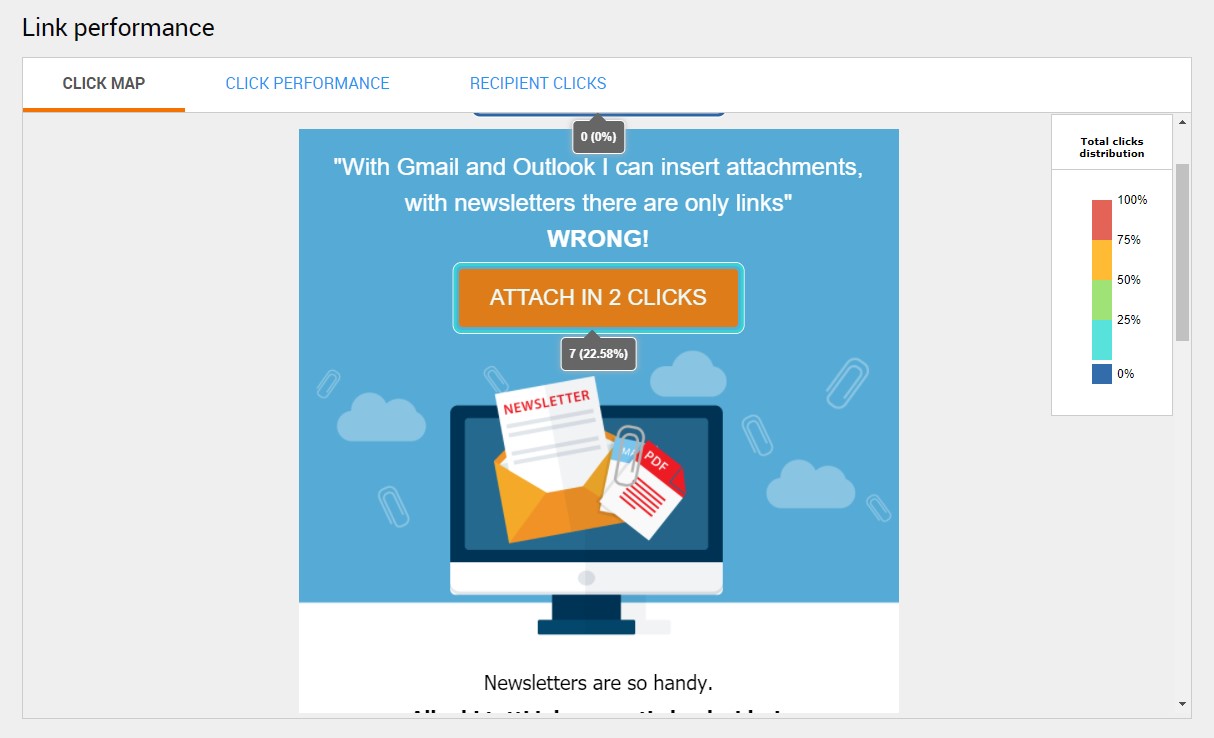
A click map shows which links in your email have been clicked and how often. It’s a measure of the effectiveness of your call-to-action strategy.
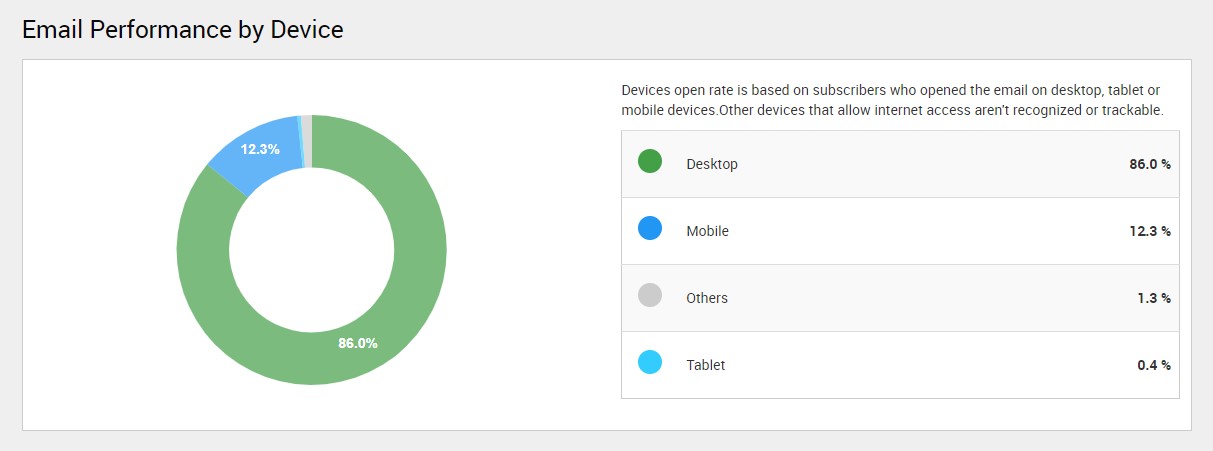
You can also see how the percentage of your email open rate differs across devices including desktop, mobile, and tablets.
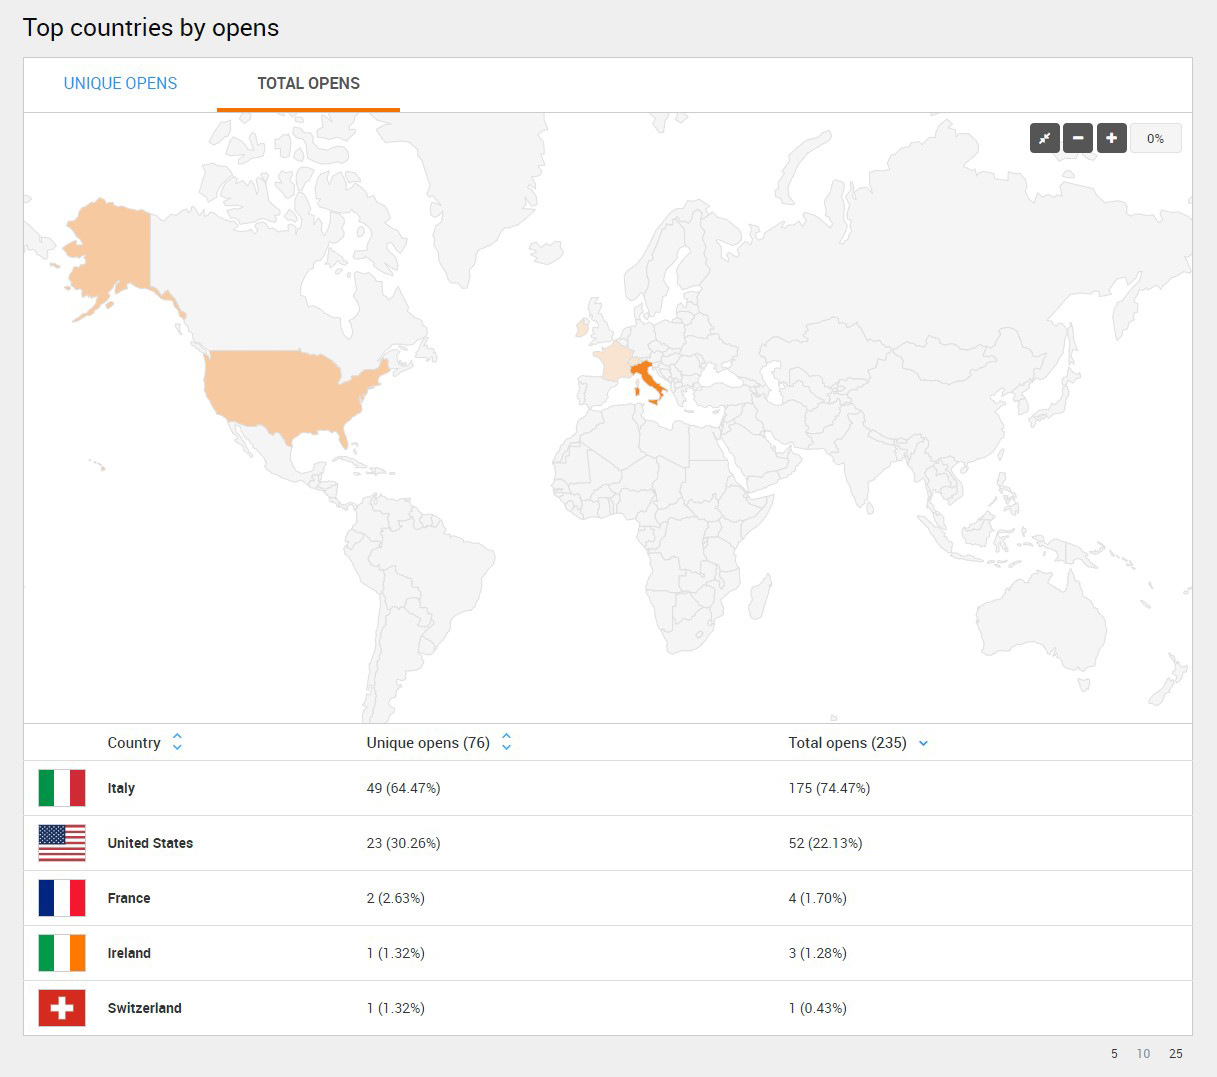
Finally, the geographic map classifies the opening of your emails by country. You can use this data to create localized segments and campaigns.


