Statistics are a key element for the success of any email marketing campaign.
Why is that?
They are the only way to know if your campaigns are working or not (and they give you the opportunity to improve your future sends). Thanks to statistics, you can find out whether your contacts are opening the emails you send, if they regularly read your messages, and most importantly, if they are clicking on your CTAs.
For this reason, Emailchef provides you with accurate, comprehensive, and always up-to-date real-time statistics, so you can monitor the performance of your campaigns at any time 🚀.
![[EN] Introducing Campaign Reports](https://emailchef.com/wp-content/plugins/wp-youtube-lyte/lyteCache.php?origThumbUrl=https%3A%2F%2Fi.ytimg.com%2Fvi%2FtAjvX0w0TGU%2F0.jpg)
You have two tools at your disposal:
- Campaign and automation reports;
- Interaction feeds for each contact.
The results of your sends are presented in highly intuitive charts, allowing you to quickly grasp the performance of your campaigns.
But that’s not all.
You can also track your performance using the chronological chart, which lets you analyze various metrics on an hourly or daily basis.
Emailchef also offers you a click map (to discover which links your contacts have clicked on) and a geographical map to analyze your results on a national scale.
But let’s take it step by step.
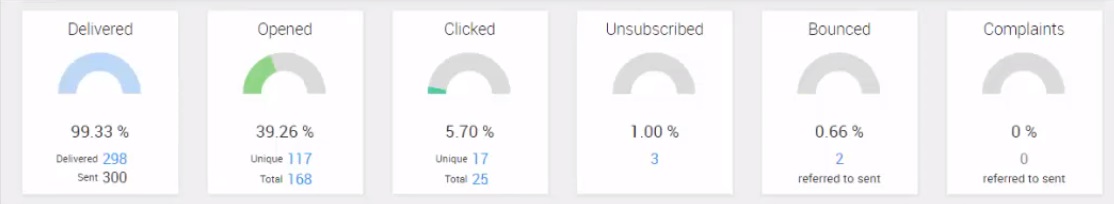
Campaign reports are one of the advanced analysis tools provided by Emailchef and help you understand the overall performance of your sends.
So, what metrics can you analyze?
To give you a few examples, you’ll be able to check your delivery rate or click-through rate, see the unsubscribe rate from your mailing list, know how many bounces were generated (i.e., how many messages failed to reach their destination), and the total number of spam complaints received.
With the chronological chart, you can identify the days and times when your recipients interact most with your content. This is valuable data that you can leverage to maximize your campaign results.
Do your contacts open emails more often over the weekend, with a click peak on Sunday afternoon? Sending your next messages at this time could be a great idea 😎.
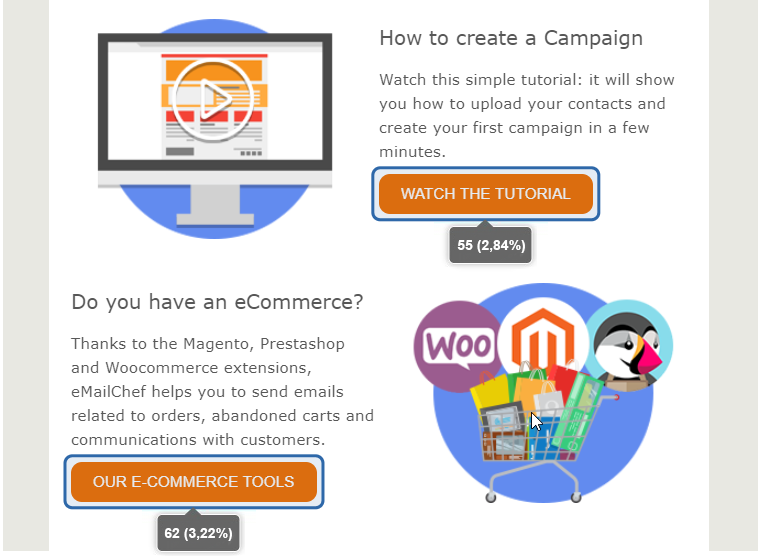
The click map is another useful tool. It shows you exactly which links your contacts clicked on (and how many times they did).
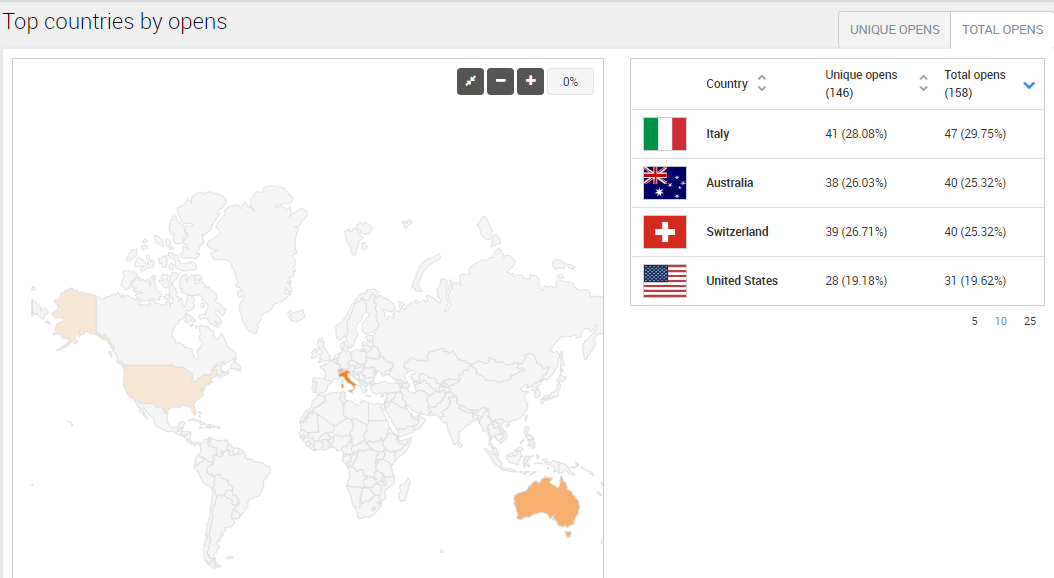
The open rate by country, on the other hand, shows you where the recipients who opened your emails are located. This service is especially useful for understanding the performance of your campaigns on a national level, particularly if they have international reach.
Did the same campaign perform well in Italy but, for example, seem less effective in France? In this case, it might be a good idea to adapt your communication for that specific country.
Emailchef allows you to print your campaign statistics in hard copy or download them as a PDF, complete with a cover page and summary sheet. If you prefer, you can customize the report by selecting only the sections that interest you, for example, including only data on opens and clicks.
And voilà, your document will be ready for a business presentation or to be shared with your team members!
![[EN] Print your campaign reports](https://emailchef.com/wp-content/plugins/wp-youtube-lyte/lyteCache.php?origThumbUrl=https%3A%2F%2Fi.ytimg.com%2Fvi%2FcuXO1vsEbRk%2F0.jpg)
So how does the contact interaction feed work?
It’s a detailed report that contains the interactions of each subscriber on your lists, helping you identify who is most interested in the content you offer.
Thanks to these reports, you’ll also have access to a complete timeline that includes all the emails received by each subscriber, shows their engagement rate in terms of opens, and indicates which links they clicked on.
For each subscriber, you can see their registration method (for example, whether they were added by an admin or signed up through a form), the date they joined the list, their IP address, geographical location, and subscription status.